R Squared Definition Calculation Formula Uses And Limitations
adminse
Mar 31, 2025 · 9 min read
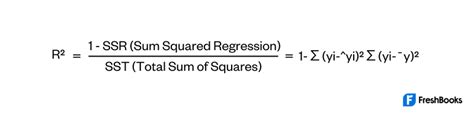
Table of Contents
R-Squared: Definition, Calculation, Uses, and Limitations – A Comprehensive Guide
What makes understanding R-squared crucial for data analysis and interpretation?
R-squared is a fundamental statistical measure that unlocks the power of regression analysis, offering crucial insights into model fit and predictive accuracy.
Editor’s Note: This comprehensive guide to R-squared has been published today.
Why R-squared Matters
In the realm of statistical modeling, particularly regression analysis, understanding the goodness-of-fit of a model is paramount. R-squared, denoted as R², serves precisely this purpose. It quantifies the proportion of variance in the dependent variable that is predictable from the independent variables in a regression model. Understanding R² allows researchers, analysts, and data scientists to assess how well their model explains the observed data, making informed decisions about model selection, prediction accuracy, and the overall reliability of their findings. This measure finds applications across diverse fields, from economics and finance predicting market trends and stock prices to healthcare analyzing patient outcomes and identifying risk factors, to engineering optimizing processes and improving efficiency. The ability to understand and interpret R² is therefore crucial for anyone working with statistical models.
Overview of the Article
This article provides a comprehensive exploration of R-squared, covering its definition, calculation, various uses, and inherent limitations. Readers will gain a thorough understanding of this crucial statistical measure and learn how to interpret its value appropriately within the context of their analysis. We will delve into the mathematical underpinnings, practical applications, and potential pitfalls associated with R², equipping readers with the knowledge to effectively utilize this powerful tool in their data analysis endeavors.
Research and Effort Behind the Insights
This article draws upon established statistical principles and widely accepted methodologies for calculating and interpreting R-squared. Information presented is supported by foundational textbooks on regression analysis and econometrics, ensuring accuracy and reliability. Numerous examples and practical illustrations are included to aid understanding and enhance the practical application of the concepts discussed.
Key Takeaways
| Key Concept | Description |
|---|---|
| Definition of R² | The proportion of variance in the dependent variable explained by the independent variables in a regression model. |
| Calculation of R² | Derived from the correlation coefficient (r) or through the analysis of variance (ANOVA). |
| Uses of R² | Model evaluation, comparing models, assessing predictive power. |
| Limitations of R² | Sensitivity to sample size, potential for overfitting, doesn't indicate causality. |
| Adjusted R² | A modified version that adjusts for the number of predictors in the model. |
Smooth Transition to Core Discussion
Let's delve into the core aspects of R-squared, starting with its precise definition and moving on to its calculation and interpretation.
Exploring the Key Aspects of R-Squared
-
Defining R-squared: R-squared represents the proportion of the total variation in the dependent variable that is explained by the independent variables in a regression model. It ranges from 0 to 1, where 0 indicates no linear relationship and 1 indicates a perfect linear relationship. A higher R-squared generally suggests a better fit, implying that the model explains a larger portion of the data's variability.
-
Calculating R-squared: There are two primary ways to calculate R-squared:
-
Using the correlation coefficient (r): R-squared is simply the square of the correlation coefficient (r), i.e., R² = r². This method is applicable when dealing with simple linear regression (one independent variable).
-
Using the Analysis of Variance (ANOVA): In multiple linear regression (two or more independent variables), R-squared is calculated using the ANOVA table. It is the ratio of the explained sum of squares (SSR) to the total sum of squares (SST): R² = SSR/SST. SSR represents the variation explained by the model, while SST represents the total variation in the dependent variable.
-
-
Interpreting R-squared: The interpretation of R-squared depends on the context of the analysis. A high R-squared (e.g., >0.8) generally indicates a good model fit, suggesting that the independent variables explain a substantial portion of the variability in the dependent variable. However, a low R-squared (e.g., <0.3) doesn't necessarily mean the model is bad; it could be due to the inherent variability in the data or the chosen variables not being strong predictors. It's crucial to consider the specific application and the nature of the data when interpreting R-squared.
-
Adjusted R-squared: A significant limitation of R-squared is that it increases with the addition of more independent variables, even if those variables are not significant predictors. Adjusted R-squared (Adjusted R²) addresses this issue by penalizing the addition of irrelevant variables. Adjusted R² is always less than or equal to R², and it provides a more accurate measure of model fit when comparing models with different numbers of predictors.
-
R-squared and Causality: It is crucial to understand that a high R-squared does not imply causality. Correlation does not equal causation. While a high R-squared suggests a strong relationship between the independent and dependent variables, it doesn't prove that changes in the independent variables cause changes in the dependent variable. Other factors could be influencing the relationship.
Closing Insights
R-squared is a valuable tool for assessing the goodness-of-fit of a regression model, providing a quantitative measure of how well the model explains the observed data. However, its interpretation requires careful consideration of the context, including the nature of the data, the number of predictors, and the potential for confounding variables. While a high R-squared is generally desirable, it shouldn't be the sole criterion for model selection. Other factors, such as the significance of individual predictors, the presence of outliers, and the underlying assumptions of the model, should also be considered. The adjusted R-squared offers a more robust measure, especially when comparing models with varying numbers of predictors.
Exploring the Connection Between Outliers and R-squared
Outliers, data points significantly deviating from the overall pattern, can substantially influence R-squared. A single outlier can artificially inflate or deflate the R-squared value, leading to a misleading assessment of model fit. The impact depends on the outlier's position relative to the regression line. Outliers with high leverage (i.e., extreme values on the independent variables) can exert a particularly strong influence. Robust regression techniques, which are less sensitive to outliers, can be used to mitigate this issue. Identifying and addressing outliers is a critical step in ensuring the reliability of R-squared as a measure of model fit. For example, in analyzing house prices, an exceptionally large mansion in a neighborhood of smaller homes could significantly skew the R-squared, making the model appear better than it actually is for predicting typical house prices.
Further Analysis of Outliers
The impact of outliers on R-squared can be analyzed through diagnostic plots, such as residual plots and leverage plots. Residual plots visually represent the differences between the observed and predicted values. Outliers typically exhibit large residuals, deviating significantly from zero. Leverage plots identify data points with high influence on the regression line. By identifying and investigating outliers, analysts can determine whether they represent genuine data points or errors, and decide whether to exclude them from the analysis or to use alternative modeling techniques that are less sensitive to outliers. A table summarizing the impact of outliers on R-squared based on their leverage and residual values can enhance understanding.
FAQ Section
-
Q: What is the difference between R-squared and adjusted R-squared? A: R-squared measures the proportion of variance explained by the model. Adjusted R-squared adjusts for the number of predictors, providing a more accurate comparison between models with different numbers of variables.
-
Q: Can R-squared be negative? A: No, R-squared cannot be negative. It ranges from 0 to 1. A value close to 0 indicates a poor model fit, while a value close to 1 indicates a good fit.
-
Q: How do I interpret an R-squared of 0.7? A: An R-squared of 0.7 means that 70% of the variation in the dependent variable is explained by the independent variables in the model. This is generally considered a reasonably good fit, but the interpretation also depends on the specific application and context.
-
Q: What should I do if my R-squared is low? A: A low R-squared suggests that the model doesn't explain much of the variation in the dependent variable. This could be due to several reasons, including poor predictor variables, nonlinear relationships, or the presence of significant outliers. Investigate these possibilities and consider alternative modeling approaches.
-
Q: Does a high R-squared guarantee a good model? A: No, a high R-squared doesn't automatically guarantee a good model. It is crucial to consider other factors, such as the statistical significance of individual predictors, the presence of outliers, and the overall validity of the model's assumptions.
-
Q: How does sample size affect R-squared? A: Larger sample sizes generally lead to more stable and reliable R-squared values. Smaller samples can lead to inflated or deflated R-squared values due to sampling variability.
Practical Tips
-
Always consider the adjusted R-squared: When comparing models with different numbers of predictors, use the adjusted R-squared rather than the raw R-squared.
-
Examine residual plots: Visual inspection of residual plots can help identify outliers and other potential problems with the model.
-
Assess the statistical significance of predictors: Ensure that the independent variables included in the model are statistically significant.
-
Consider transformations of variables: If the relationship between the dependent and independent variables is nonlinear, consider transforming the variables (e.g., logarithmic transformation) before performing the regression analysis.
-
Check for multicollinearity: High multicollinearity (high correlation between independent variables) can inflate the standard errors of the regression coefficients and make it difficult to interpret the individual effects of the predictors.
-
Use robust regression techniques: If outliers are present, consider using robust regression methods that are less sensitive to extreme values.
-
Remember that correlation does not equal causation: A high R-squared doesn't imply that the independent variables cause changes in the dependent variable; it simply indicates a strong association.
Final Conclusion
R-squared is a fundamental statistical measure in regression analysis, providing valuable insights into the goodness-of-fit of a model. Understanding its calculation, interpretation, and limitations is crucial for data analysts and researchers. While a high R-squared is generally desirable, it's essential to consider other factors, such as adjusted R-squared, residual plots, and the significance of predictors, for a complete assessment of model quality. Careful interpretation of R-squared, along with other diagnostic measures, ensures that the conclusions drawn from regression analysis are valid and reliable. The appropriate use of R-squared, coupled with other statistical techniques, enables informed decision-making across diverse fields relying on data-driven insights. Further exploration of advanced regression techniques and diagnostic tools can further enhance the accuracy and reliability of model interpretation.
Latest Posts
Related Post
Thank you for visiting our website which covers about R Squared Definition Calculation Formula Uses And Limitations . We hope the information provided has been useful to you. Feel free to contact us if you have any questions or need further assistance. See you next time and don't miss to bookmark.
